

Tableau Vs Spotfire
Practical Computer Applications (PCApps) evaluates Tableau, Spotfire, and other data visualization and BI products to select the most appropriate software to solve our clients business problems.
The table below lists some generalized data visualization comparison data, but each company’s needs are different — call us to discuss your specific data analysis situation!
We use the capabilities of Tableau and Spotfire to produce charts that behave as interactive synchronized dashboards supporting advanced visual drill down, slicing and dicing functionality and use sophisticated calculated fields and formulas in both Tableau and Spotfire to implement custom business logic.
We use the highly optimized in-memory data engine provided by both Tableau and Spotfire to enable fast interactions with big data sets. Spotfire and Tableau using in-memory columnar database and both are able to use the disk space as a virtual memory to enable unlimited / scalable data for visualizations. For more detailed comparison of Tableau vs Spotfire please review the worksheet below:
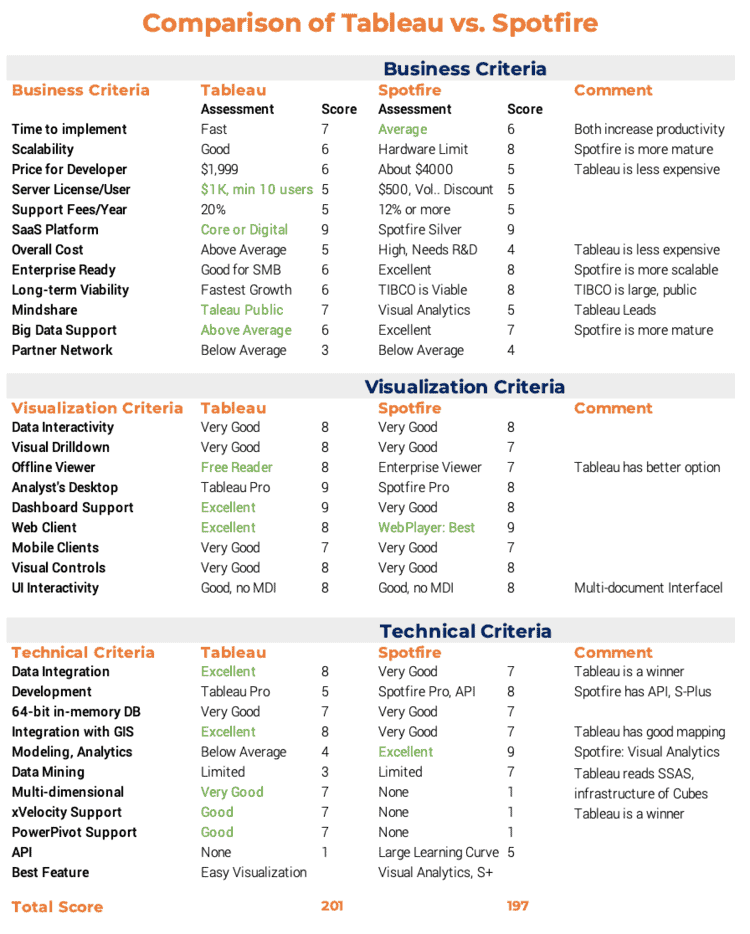
Tableau has a simple portfolio: Desktop, Server and Reader:
- We use Tableau Desktop to design data visualizations as windows applications, to make the data visible, to enable analysts to interact with data and analyze them on their desktop and to deploy visualizations to Tableau Server.
- We use Tableau Server to convert data visualizations to multi-user web applications, to manage users and groups, to automate data updates and to provide multi-tenant databases and security for users and data.
- Tableau Reader is a free windows application and when appropriate, we use it to enable server-less distribution of data visualizations, to reduces IT requirements and to make world-class visual analytics available even to small businesses.
Tableau provides 30+ Data Connectors, Adapters and Drivers (in addition to standard connections to ODBC, flat files, OData, Azure data) to multiple data sources for free. Tableau has the excellent and native mapping functionality.
Spotfire portfolio includes Professional Desktop Tool for developers and Analysts, Server, Web Player Server, Spotfire Silver, popular S-Plus package and other products like Spotfire Application Data Services, Automation Services, API etc.
- We use Spotfire professional to design data visualizations, to make the data visible, to enable analysts to interact with data on their desktops and to deploy visualizations to the Spotfire Server.
- We use Spotfire Server and Spotfire Web Player Server to convert data visualizations to multi-user web applications, to manage users and groups, to automate data updates and to provide security for users and data.
- With Spotfire Application Data Services and Automation Services, we centralize the distribution of Spotfire applications and automates data updates.
- We use Spotfire S-Plus and Spotfire API to customize data visualizations and analytical applications for clients.
Tableau allows to distribute data visualizations and interactive visual reports without any server and for free, while maintaining the central database, which is the (Central DB that is) advantage of all Smart Client applications, developed by us.
We use Spotfire API, S-Plus scripting (commercial version of R statistical Language) and Spotfire integration with .NET and Visual Studio for deeper customization of data visualizations if needed.
It is a PCApps experience that the analytical applications in many cases need to be able to use OLAP Cubes from SSAS (SQL Server Analytic Services) and Excel PowerPivot as data sources while preserving all Cube infrastructure, design, dimensions, measures and calculations. Spotfire currently does not support this functionality while Tableau is only advanced data visualization tool which can use SSAS Cubes and connect to PowerPivot. From this point of view Tableau is a better choice for serious analytical applications.
