

Data Warehousing with SQL Server
Practical Computer Applications (PCApps) engages a variety of technologies for data collection into data sourcing databases.
- Extracts them into data staging databases
- Transforms those data into a data warehouse
- Loads all of it to a data mart

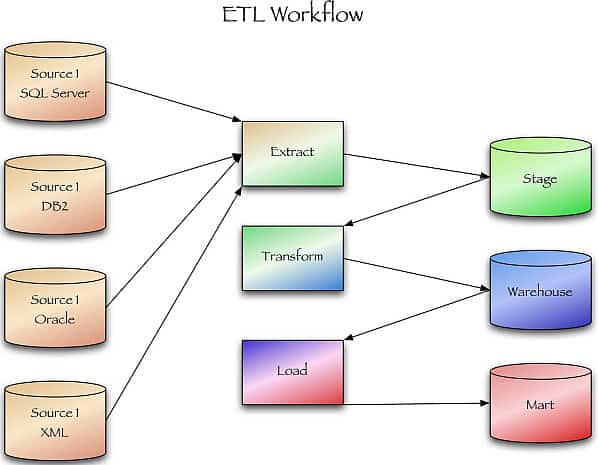
ETL Workflow
In many cases, in order to reduce the complexity of the infrastructure of the project, we will combine the data warehouse and data mart into one data store and call it DW for short.
In a traditional interpretation, the term Business Intelligence (BI) describes the process of extracting information from data. An integral part of any BI system is the data warehouse — a central repository of data that is regularly refreshed by the ETL processes we mentioned above.
SQL Server Integration Services – SSIS – is the most advanced technology for the ETL processes and we usually recommend for most of our projects. Typically the data warehouse (DW) is structured with a star schema.
After data is loaded/refreshed into the data warehouse, many BI systems usually reprocess subsets of the data into function-specific multi-dimensional OLAP cubes (typically implemented with SSAS – SQL Server Analysis Services) or other data structure optimized for Data Visualization, Reporting Systems (typically implemented with SSRS – SQL Server Reporting Services) and Dashboards.
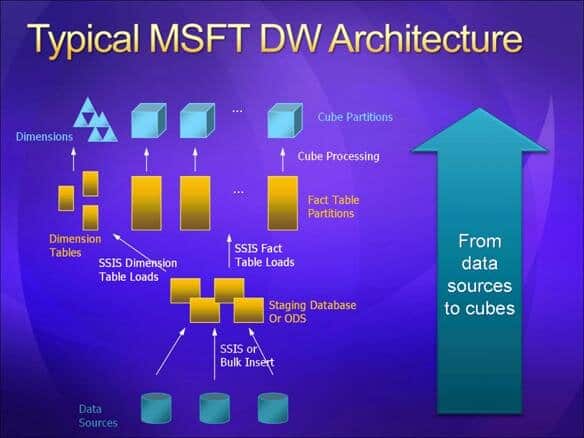
Typical MSFT DW Architecture
We always start with Business Discovery and captures it in Analytical Requirements.
In a large enterprise, users tend to split into many groups, each with different analytical requirements. Users in each group often articulate the analysis they need in terms of graphs, grids of data (worksheets), and printed reports.
These are visually very different but all essentially present numerical measures filtered and grouped by the members of one or more dimensions.
PCApps will capture the analytical requirements of a group simply by formalizing the measures and dimensions that they use.
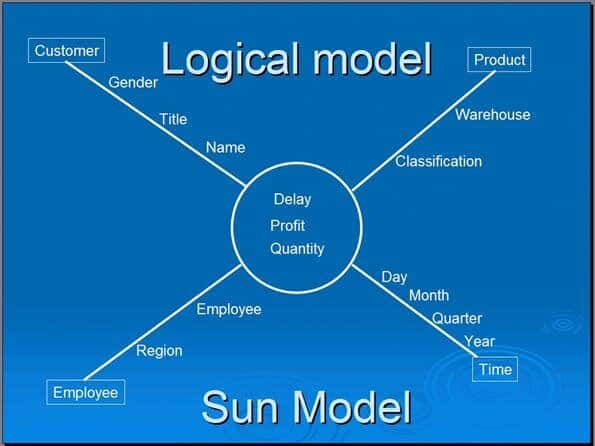
The Model
As shown in the picture above, these requirements can be presented graphically together with the relevant hierarchical information in the so-called “Sun model”, which is the logical model of the analytical requirements and capture the analytical requirements of users in terms of measures, dimensions, and hierarchical structure.
One of the main reasons to generate reports is to transform data into information for the business user and enable the user to explore and drill down data.
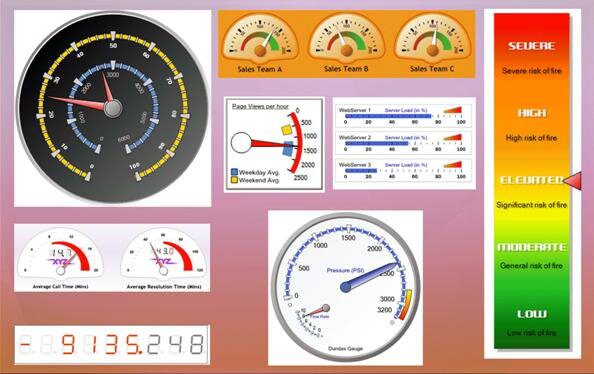
Most people find graphics easier to understand than numbers. With SSAS and SSRS reports the dashboard can contain the gauges and/or KPIs (Goal, Value, Status, Trend, Weight, Indicator, etc.), as a visual output.
A gauge displays a single value from the data. As the picture below shows, gauges are particularly useful for creating an easy-to-read dashboard that displays and compares several values and monitor them for alerts, alarms, and actions.
Massive Parallel Processing
Recently Microsoft added to the SQL Server portfolio a Parallel Data Warehouse (PDW) with Massive Parallel Processing (MPP) Architecture, and the ability to scale above 100s of Terabytes. PDW is appliances already available from HP and Dell.
