

What Is An Outlier?
Malcolm Gladwell, author of “Outliers” defines the term as a phenomena that lie outside normal experience“.
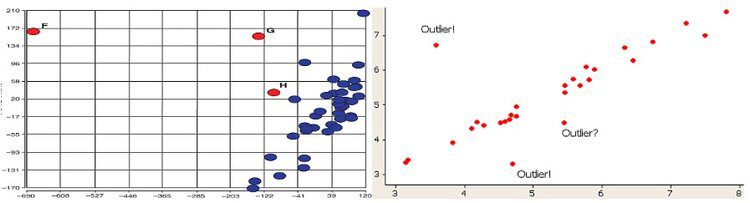
For many situations Scatter Plots are used to visually detect suspected and extreme outliers. For example, on the Left Scatter Chart below, two data points (labeled as E and G) are outliers and data point labeled as H is just a suspected outlier. On the right Scatter Chart below, two data points are marked as an Outlier! and one data point marked as an outlier? because it is a suspected outlier:
J. W. Tukey invented the Box-and-Whisker Plot to display groups of data with the specific goal to Visualize Outliers. To create a box-and-whisker plot, draw a box (the central rectangle spans the first quartile to the third quartile (the interquartile range or IQR)) with ends at the quartiles and draw the statistical median as a horizontal line in the box. Now extend the “whiskers” to the farthest points that are not outliers (i.e., that are within 3 / 2 times the IQR – interquartile range of and). Then, for every point more than 3 / 2 times the interquartile range from the end of a box, draw a dot. If two dots have the same value, draw them side by side.
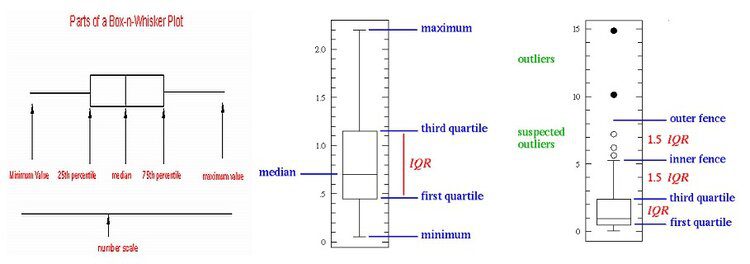
Often real datasets will display surprisingly high maximums or surprisingly low minimums called outliers. John Tukey (see above) has provided a precise definition for two types of outliers: Outliers are either 3×IQR or more above the third quartile or 3×IQR or more below the first quartile.
And Suspected outliers are slightly more “central” versions of outliers: either 1.5×IQR or more above the third quartile or 1.5×IQR or more below the first quartile. If either type of outlier is present the whisker on the appropriate side is taken to 1.5×IQR from the quartile (the “inner fence”) rather than the max or min, and individual outlying data points are displayed as unfilled circles (for suspected outliers) or filled circles (for outliers). (The “outer fence” is 3×IQR from the quartile.)
Read more about Outlier Detection.
