
Practical Computer Applications (PCApps) evaluates Tableau, Qlikview and other excellent data visualization and BI products to select the most appropriate software to solve our clients business problems.
We implement Tableau and Qlikview visualizations so most charts behave as interactive synchronized data filters and support advanced visual drill down, slicing and dicing functionality. We use sophisticated calculated fields and formulas in both tools to implement custom business logic.
We use the in-memory data engine, provided by both Qlikview and Tableau to enable fast interactions with huge data sets. While Qlikview in-memory columnar database has a more advanced and faster data engine, Tableau is able to use the disk space as a virtual memory to enable unlimited / scalable data for visualizations. In the “Data Engine Department”, Qlikview is preferable if the analyst needs speed; Tableau is usually the better choice if scalability is the main requirement, and Tableau is generally used for PCApps projects.
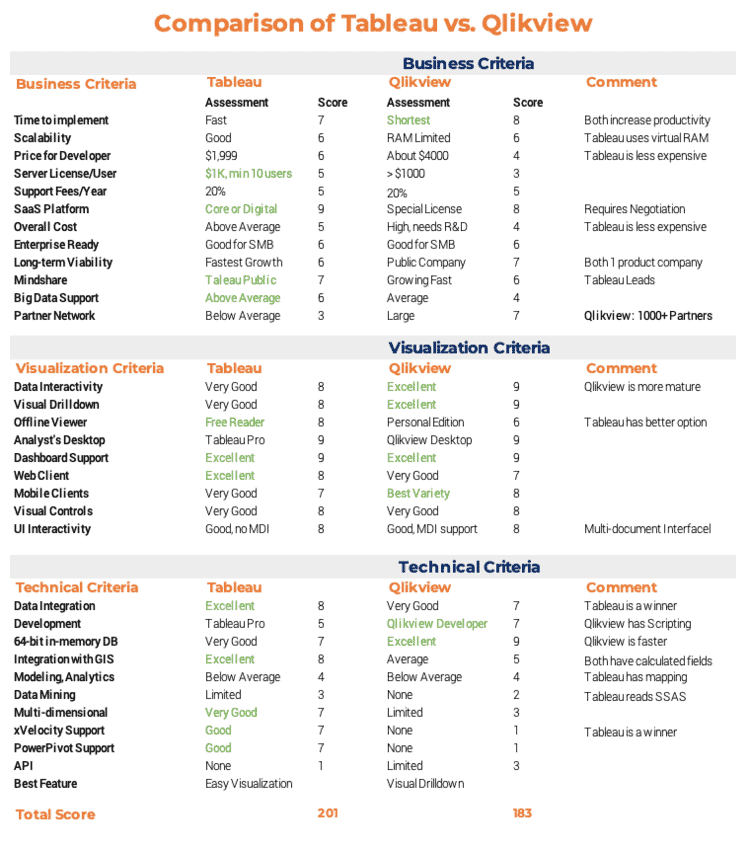
Tableau has a simple portfolio: Desktop, Server and Reader:
- We use Tableau desktop to design data visualizations as windows applications, to make the data visible, to enable analysts to interact with data and analyze them on their desktop and to deploy visualizations to Tableau Server.
- We use Tableau Server to convert data visualizations to multi-user web applications, to manage users and groups, to automate data updates and to provide multi-tenancy and security for users and data.
- Tableau Reader is a free windows application and we use it to enable server-less distribution of data visualizations, to reduce IT requirements and to make world-class visual analytics available even to small businesses.
Tableau provides all Data Connectors, Adapters and Drivers (about 30 of them, in addition to ODBC, flat files, OData, Azure) to multiple data sources for free. Tableau has an excellent and native mapping functionality. For a more detailed comparison of Tableau vs. Qlikview please review the worksheet below:
Qlikview portfolio includes Client Tool, Server, Publisher, Information Access and Extranet Servers (as well as others like Workbench, PDF Reporting Server and at least three non-standard data connectors (in addition to ODBC and standard data connectivity))
- We use Qlikview client to design data visualizations, to make the data visible, to enable analysts to interact with data on their desktops and to deploy visualizations to Qlikview Server.
- We use Qlikview Server to convert data visualizations to multi-user web applications, to manage users and groups, to automate data updates and to provide security for users and data.
- With Qlikview Publisher the PCApps centralizes the distribution of Qlikview applications and automates data updates.
- Qlikview Information Access Server allows unlimited public access to one visualization while Qlikview Extranet Server allows access to three visualizations via private web site(s).
Even on portfolio level, Qlikview has some warning flags / points from our point of view: portfolio is more complicated compare with Tableau, data connectivity is less sophisticated, multi-tenancy is not supported, and access to different data visualizations (Documents in Qlikview’s speak) is limited either by server or by license. And yes, the access to each Qlikview Document (Data Visualization) requires $350 fee per named user per document.
On other hand, Tableau is the only platform which allows to us to distribute data visualizations and interactive visual reports server-less and for free, while maintaining the central database, which is the (Central DB that is) advantage of all Smart Client applications, developed by us.
We uses Qlikview scripting for deeper customization of data visualizations if needed.
Our experience is that the analytical applications in many cases need to be able to use OLAP Cubes from SSAS (SQL Server Analytic Services) and Excel PowerPivot as data sources while preserving all Cube infrastructure, design, dimensions, measures and calculations. Qlikview currently does not support this functionality while Tableau is only advanced data visualization tool which can use SSAS Cubes and connect to PowerPivot. From this point of view Tableau is a much better choice for serious analytical applications.
