

Business Intelligence Consulting & Design Services
Business Intelligence describes methods used to extract interesting and actionable information
from your data in a way that enables better informed business decisions.
Effective BI solutions help you discover the various factors that impact the performance of your business, from both cost and revenue perspectives. While BI solutions can share similar tools and methods, each project has its own set of requirements and challenges that are unique to a particular business and data set.
BI solutions are designed to provide users with a multi-dimensional view of your business data to help you understand your company’s impact, and to analyze your business operations. Key factors that determine the return on investment (ROI) of a Business Intelligence Service include the robustness (quality and completeness) of your business data, the commitment from management to exploit Business Intelligence to inform decisions, and the design of the Business Intelligence Service or solution.
Business Intelligence Methods
Depending upon your specific business needs, several different methods are available to deploy BI solutions, including: Dashboards, Pivot Tables, Cubes, Data Mining, Data Warehousing and other Business Intelligence Services.
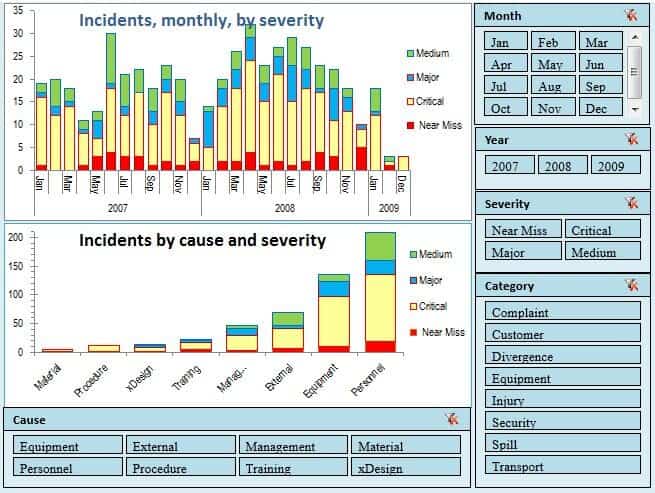
Dashboards
Business Dashboards are highly summarized graphical representations of key business performance indicators (KPIs). Dashboards can include simple controls to filter data to specific elements of the business. They are designed to be highly intuitive, and provide the minimum information necessary to spur management inquiry or action.
Pivot Tables
MS Excel pivot tables are the conventional way most people get introduced to slicing and dicing business data.They tend to be simple, two-dimensional (rows and columns) summaries of smaller sets of business data. Professionals who are accustomed to analyzing business data in Excel pivot tables will benefit greatly from taking this to the next level with SQL Pivot Grids.

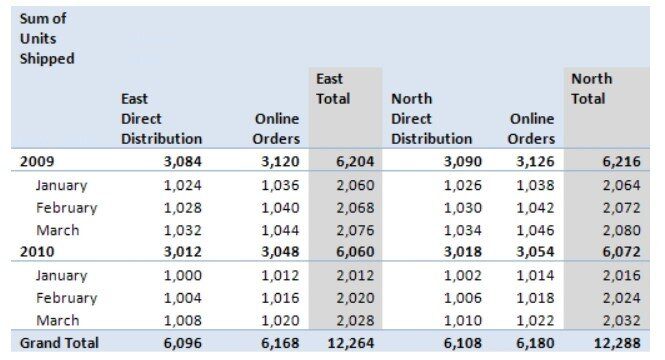
OLAP Cubes
Cubes are like Excel Pivot tables on steroids! They consist of adding up data (measures) along various category lines (dimensions) of data. Compared to a SQL relational database, OLAP (OnLine Analytical Processing) cubes provide a consistently faster response and enable powerful metadata-based queries.
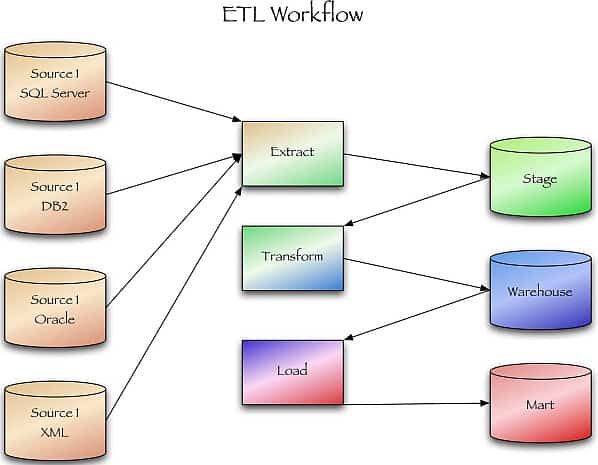
Data Warehouse
Data warehouses are repositories for storing and analyzing information. It’s possible for BI reports to come directly out of relational databases and oftentimes, it makes sense to pre-process information from various data sources into a formal data warehouse to improve processing, decrease complexity. This will improve the concurrency of both your OLTP and OLAP applications.
We have successfully designed and deployed BI solutions for our clients in a broad range of industries and variety of line-of-business needs. Our Business Intelligence Service engagements start with an up-front assessment of your business objectives and KPIs and underlying sources of historical business data. Once the business drivers and data sources are well understood, the effort to build a repeatable end-to-end data flow gets underway. Most of our focus is not on the BI infrastructure, but on end users’ business needs, how best to deploy the appropriate data to the points of need in your organization, and providing a reliable, easy-to-use and highly flexible BI application interface to satisfy users business needs. Using standard Microsoft components, PCApps can design and build a robust, custom BI solution faster, at lower cost, and with substantially fewer technical risks than most packaged BI solutions, and provide the experience and insights to insure that you fully realize your BI investment.
