

Business / Executive Dashboards
Practical Computer Applications (PCApps) builds custom analytical dashboards to provide easy access to the key performance indicators (KPIs) within your data in your business database. To facilitate business analysis, our data consultants construct executive dashboards to match the information requests needed by each type of C-Level user including CEO dashboards, CFO dashboards, executive dashboards, sales dashboards, reporting dashboards, and financial dashboards, to name a few. To provide easy online access to your data, we design and build online web dashboards. Contact us for more information about our business dashboard consulting services.
With a spreadsheet containing large amounts of business data, it is often difficult to find the relevant pieces of data. For example, with a database containing thousands of incidents, how would you find the trends, outliers, and associations of data? Spreadsheet data views makes this type of search difficult.
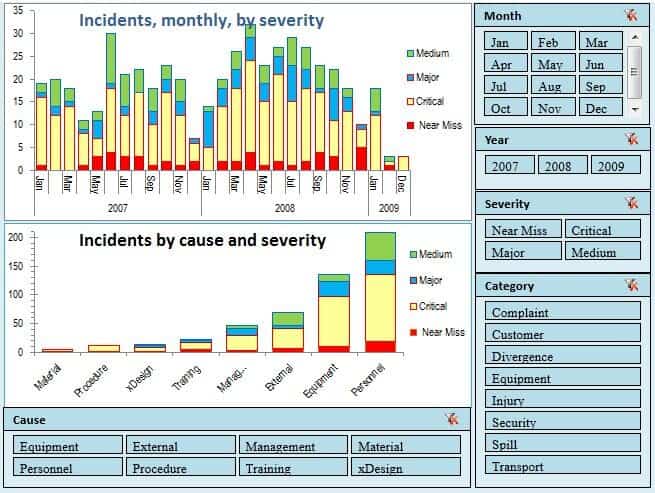
In the example below, proper data visualization using an executive data dashboard reduces the time needed for such a search and enables the data analyst to work with charts and filters instead of large spreadsheet. This is a screen shot of an Excel-based Data Visualization Management Dashboard of the spreadsheet data with two charts and five filters. View the page with the live demo.
To find the the “Needle in Haystack” the analyst uses the (Pivot-based) filters on right and bottom side of charts. The result of the search of the “Needle in Haystack” can be presented with the same charts and filters but with only the relevant data visualized. This executive dashboard clearly shows that three “near miss” incidences caused by “management” were found and they occurred in June and July of 2008 and Feb of 2009. The same reporting dashboard techniques can be used to develop custom sales dashboards and other custom business dashboards with your data.

We choose Excel to demonstrate a visual drill down function of reporting dashboard data visualization because many of our potential customers already use Excel. In reality Excel may or may not be the a part of a dashboard development implementation. With a variety of methods we can discover customer needs and implement appropriate business dashboard solutions. In addition or instead of Excel, we may use a smart client framework or apply other advance data visualization technologies, like Tableau Dashboards, Spotfire Dashboards or Qlikview Dashboards.
Our business dashboard consultants can work with you to set up a useful data visualization dashboard for your business data. This will reduce the time needed for searches and enable users to work with charts and filters instead of spreadsheets.
