

What Is Power Pivot?
Power Pivot is a current Microsoft offering for the so-called “self-serviced” Business Intelligence (BI) market. For users to get something based on Microsoft “BI-stack”, comparable with Qlikview-based or Spotfire-based Data Visualizations, they need an expert consultant, like Practical Computer Applications (PCApps).
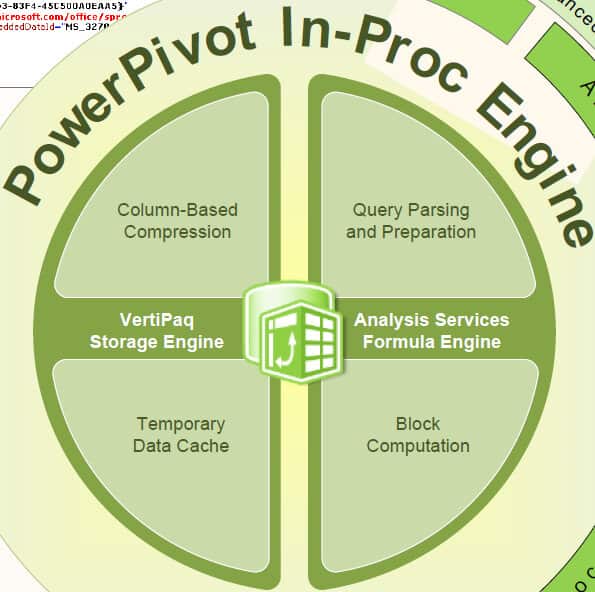
Power Pivot is a Microsoft answer to Qlikview’s in-memory columnar database and Microsoft uses Excel as the front-end for PowerPivot. The back-end API of PowerPivot is available only if packaged with SharePoint and SQL Server, which means that enterprise users will need a consulting services to integrate all these moving parts. PowerPivot is an excellent in-memory columnar database, probably the fastest on market. It simplifies the functionality available from SQL Server Analysis Service by including needed functionality which was previously available only in Visual Studio and SQL Server.
Power Pivot can be used only with Excel 2010 and therefore inherits Excel’s advantages and disadvantages. For example, Excel 2010 has no visual drill-down capabilities and if users needed it, they need to complement Excel with Smart Client and PCApps already has appropriate framework for it. Furthermore, it is not possible to outline a rectangle section of a bar chart with a mouse, and have that outlined area be a drill-down selection. Excel 2010 requires the use of “slicers” to allow users to drill into the data.
However, one of the biggest advantages of PowerPivot over other BI and Data Visualization tools is it’s Data Analysis Expressions (DAX) language is a new formula language that allows users to define custom calculations in PowerPivot tables (calculated columns) and in Excel PivotTables (measures). DAX includes functions that are used in Excel formulas, and additional functions that are designed to work with relational data and perform dynamic aggregation. In the next version of SSAS, DAX and other PowerPivot features will be available with MDX (old Multi-Dimensional eXpression language).
Many companies have Excel and PowerPivot and use it to solve their reporting and analytical problems. Excel 2010 as a front-end for PowerPivot limits data visualization and dashboard functionality, for example for instant and synchronous drill-down of visible data, Excel users need to employ slicers and pivots for filtering operations and slicers had to be preliminary and manually reconnected to all pivots who are data-sources for Pivot Charts. Some types of charts are excluded from relationships with pivots and slicers, e.g. scatters, bubbles and stock charts. Limitations mentioned above can be reduced by applying PCApps Smart Client framework and other PCApps consulting services.
In any case, it is clear that Power Pivot is a large part of the future of Microsoft’s BI stack and PCApps is ready to provide expertise and consulting services for clients who decided to use Power Pivot. For Microsoft-based solutions, the Business Intelligence applications are either PowerPivot-based or SSAS-based which is just as a PowerPivot on steroids; SSAS is more secure than PowerPivot and has no 2GB limitation on file size.
